반응형
1. 데이터
iris 데이터를 이용합니다.
> head(iris)
  Sepal.Length Sepal.Width Petal.Length Petal.Width Species
1          5.1         3.5          1.4         0.2  setosa
2          4.9         3.0          1.4         0.2  setosa
3          4.7         3.2          1.3         0.2  setosa
4          4.6         3.1          1.5         0.2  setosa
5          5.0         3.6          1.4         0.2  setosa
6          5.4         3.9          1.7         0.4  setosa
Species 는 수치형 데이터가 아니므로 제거해줍니다.
> data=iris[,1:4]
> head(data)
  Sepal.Length Sepal.Width Petal.Length Petal.Width
1          5.1         3.5          1.4         0.2
2          4.9         3.0          1.4         0.2
3          4.7         3.2          1.3         0.2
4          4.6         3.1          1.5         0.2
5          5.0         3.6          1.4         0.2
6          5.4         3.9          1.7         0.4
2. 기본 그래프
pairs 함수를 사용합니다.
data=iris[,1:4]
pairs(data)

3. 상관계수 추가
panel.cor 이라는 함수를 정의하여 사용합니다. (출처: R docmentation)
data=iris[,1:4]

panel.cor <- function(x, y, digits = 2, prefix = "", cex.cor, ...)
{
  usr <- par("usr"); on.exit(par(usr))
  par(usr = c(0, 1, 0, 1))
  r <- abs(cor(x, y))
  txt <- format(c(r, 0.123456789), digits = digits)[1]
  txt <- paste0(prefix, txt)
  if(missing(cex.cor)) cex.cor <- 0.8/strwidth(txt)
  text(0.5, 0.5, txt, cex = cex.cor * r)
}

pairs(data,lower.panel=panel.cor)

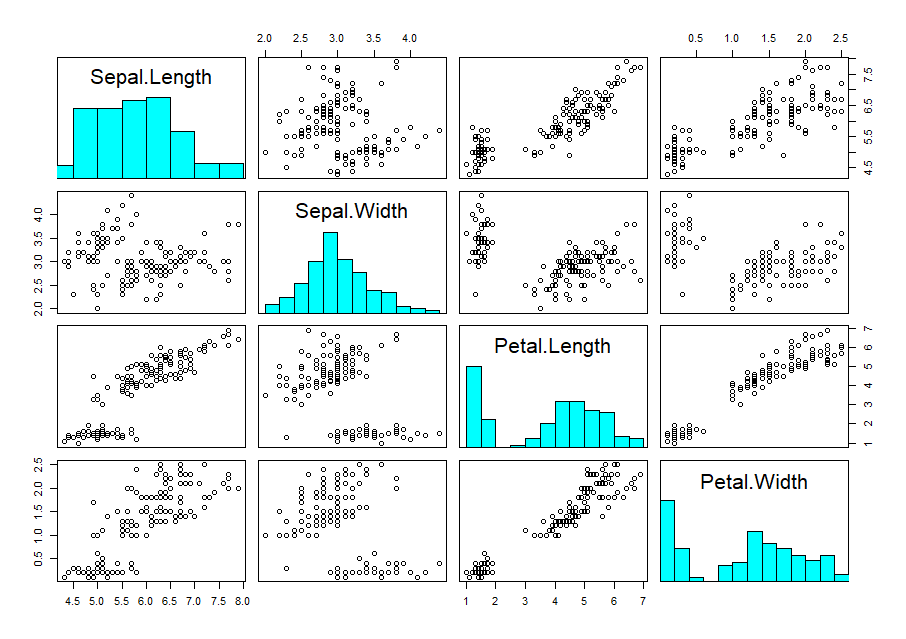
3. 히스토그램 추가
panel.hist 라는 함수를 정의하여 사용합니다. (출처: R docmentation)
data=iris[,1:4]

panel.hist <- function(x, ...)
{
  usr <- par("usr"); on.exit(par(usr))
  par(usr = c(usr[1:2], 0, 1.5) )
  h <- hist(x, plot = FALSE)
  breaks <- h$breaks; nB <- length(breaks)
  y <- h$counts; y <- y/max(y)
  rect(breaks[-nB], 0, breaks[-1], y, col = "cyan", ...)
}

pairs(data,diag.panel = panel.hist)
반응형
'10. 상관분석 > 상관계수행렬' 카테고리의 다른 글
| [R] 상관계수행렬 그리는 법 (psych 패키지 이용) - 이게 젤 나음 (0) | 2023.08.24 |
|---|---|
| [R] 상관계수행렬 그리는 법 (ggpairs 이용, 색구분) (0) | 2023.01.06 |
| [R] 상관계수행렬 그리는 법 (ggpairs 이용) (0) | 2022.12.26 |
| [R] 상관계수행렬 그리는 법 (corrplot 패키지 이용) (0) | 2021.06.14 |
| R 피어슨 상관분석 (0) | 2019.12.02 |


댓글