반응형
mtcars 대신 사용하려는 데이터 넣으면 됩니다.
-0.9이하, 0.9이상에서 색이 변하는 것으로 되어 있음.
변경을 원하면 rampcol, match, fill 이부분 바꾸면 됨.
# Load libraries
library(tidyverse)
library(GGally)

# Load some example data
mtcars <- mtcars[,1:6]

# Define function to colour panels according to correlation
cor_func <- function(data, mapping, method, symbol, ...){
  x <- eval_data_col(data, mapping$x)
  y <- eval_data_col(data, mapping$y)

  corr <- cor(x, y, method=method, use='complete.obs')

  colFn <- colorRampPalette(c("dodgerblue", "white","firebrick" ),
                            interpolate ='spline')
  rampcols <- colFn(100)
  match <- c(rampcols[1:10], rep("#FFFFFF", 80), rampcols[90:100])
  fill <- match[findInterval(corr, seq(-1, 1, length = 100) )]

  ggally_text(
    label = paste(symbol, as.character(round(corr, 2))),
    mapping = aes(),
    xP = 0.5, yP = 0.5,
    color = 'black',
    ...) +
    theme_void() +
    theme(panel.background = element_rect(fill = fill))
}

plot1 <- ggpairs(mtcars,
                 upper = list(continuous = wrap(cor_func,
                                                method = 'spearman', symbol = "Corr:\n")),
                 lower = list(continuous = function(data, mapping, ...) {
                   ggally_smooth_lm(data = data, mapping = mapping)}),
                 diag = list(continuous = function(data, mapping, ...) {
                   ggally_densityDiag(data = data, mapping = mapping)}
                 ))

plot1
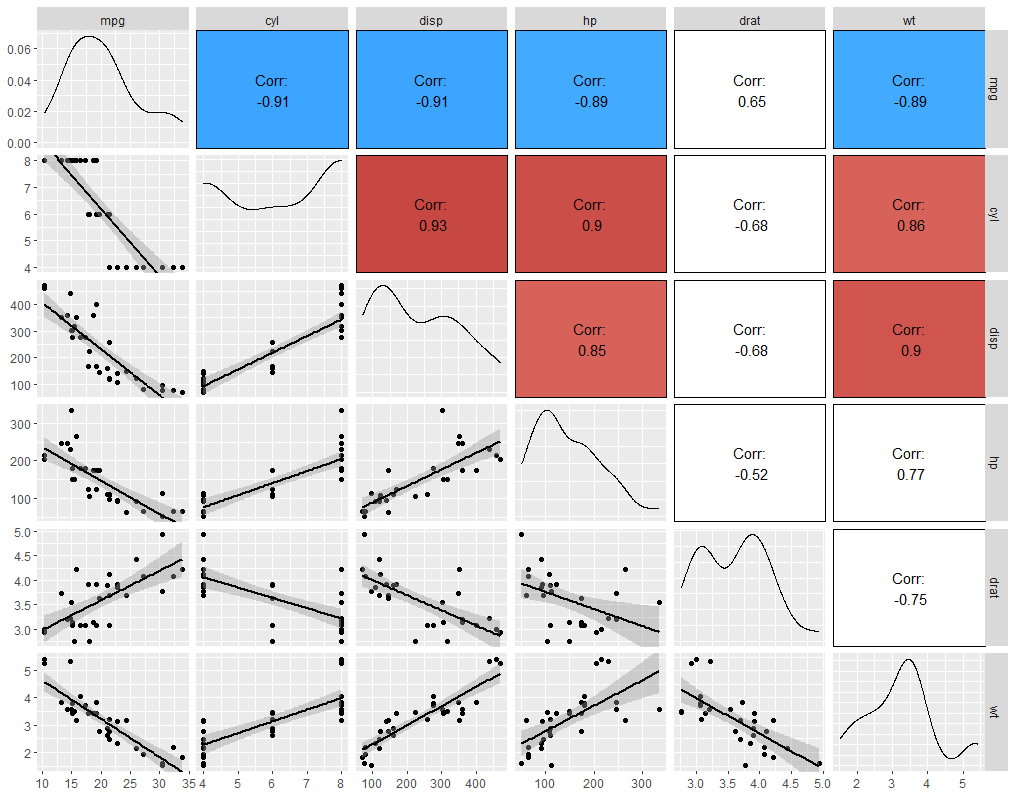
만약 -0.6 과 0.6을 기준으로 하고 싶다면 아래와 같이 수정하면 됩니다.
  rampcols <- colFn(200)
  match <- c(rampcols[1:40], rep("#FFFFFF", 120), rampcols[(61+100):(100+100)])
  fill <- match[findInterval(corr, seq(-1, 1, length = 200) )]
<출처>
반응형
'10. 상관분석 > 상관계수행렬' 카테고리의 다른 글
| [R] 상관계수행렬 그리는 법 (psych 패키지 이용) - 이게 젤 나음 (0) | 2023.08.24 |
|---|---|
| [R] 상관계수행렬 그리는 법 (ggpairs 이용) (0) | 2022.12.26 |
| [R] 상관계수행렬 그리는 법 (corrplot 패키지 이용) (0) | 2021.06.14 |
| [R] 상관계수행렬 그리는 법 (pairs 함수 이용) (0) | 2021.06.14 |
| R 피어슨 상관분석 (0) | 2019.12.02 |


댓글